The loan that looked safe – until it wasn’t
The file looked clean. Stable employer. Salary credited on time every month. A CIBIL score sitting comfortably above 750. Your team approved the loan.
Six months later, the borrower missed two EMIs.
Sound familiar? In most cases, the warning was there — buried inside the bank statement, invisible to anyone who wasn’t running a proper EMI analysis.
The metric that would have flagged this borrower? The EMI burden ratio. It is one of the most powerful signals in credit underwriting — and one of the most underused. According to the Reserve Bank of India’s guidelines on responsible lending, assessing a borrower’s total debt obligations relative to income is a core pillar of sound credit appraisal.
This article is a practical guide for credit teams who want to embed it into their workflow and start making sharper lending decisions.
What the EMI burden ratio reveals that a credit score simply cannot
A credit score tells you how a borrower has behaved in the past. The EMI burden ratio tells you how much pressure they are under right now.
The calculation is straightforward:
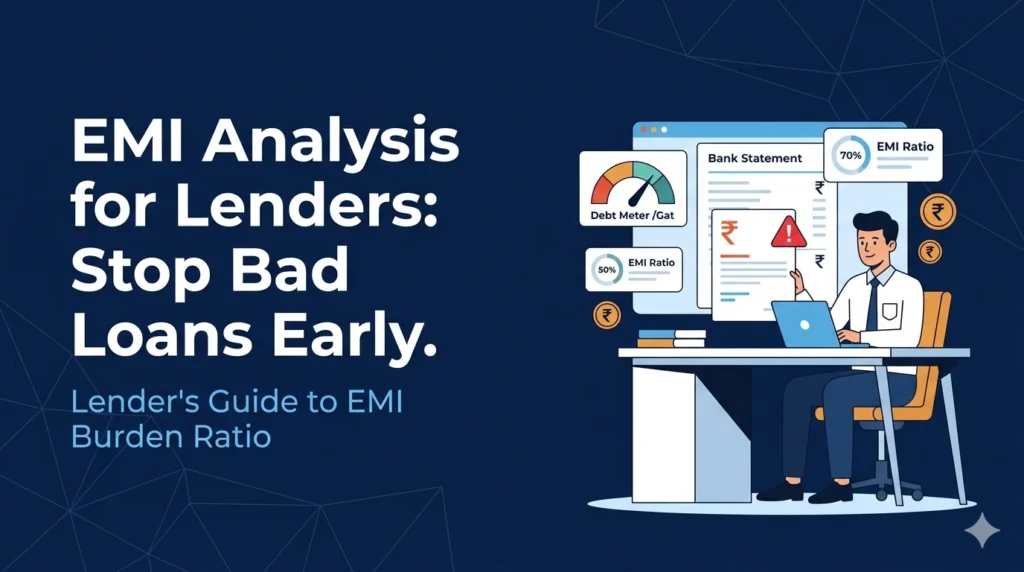
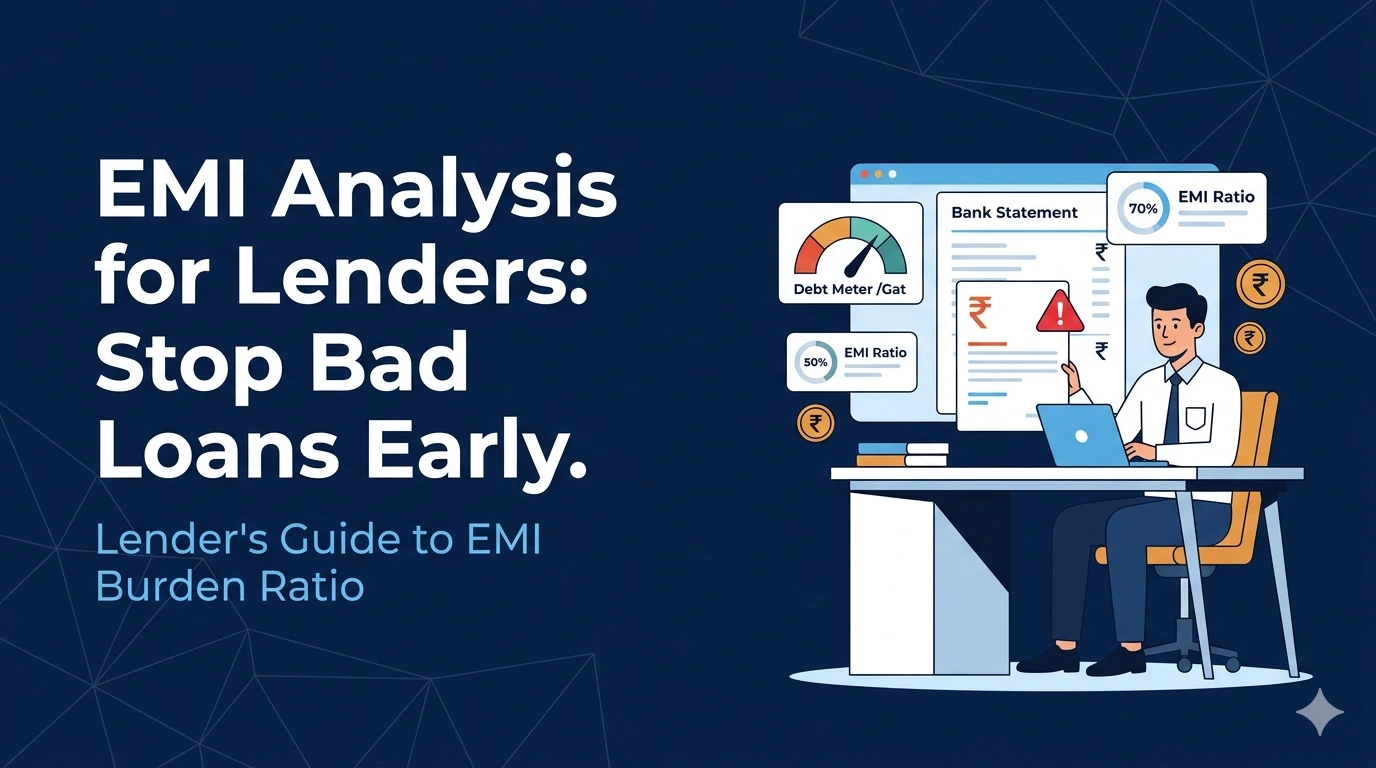
EMI Burden Ratio = (Total Monthly EMI Obligations ÷ Net Monthly Income) × 100
The result shows what percentage of a borrower’s take-home income is already committed to debt repayments each month.
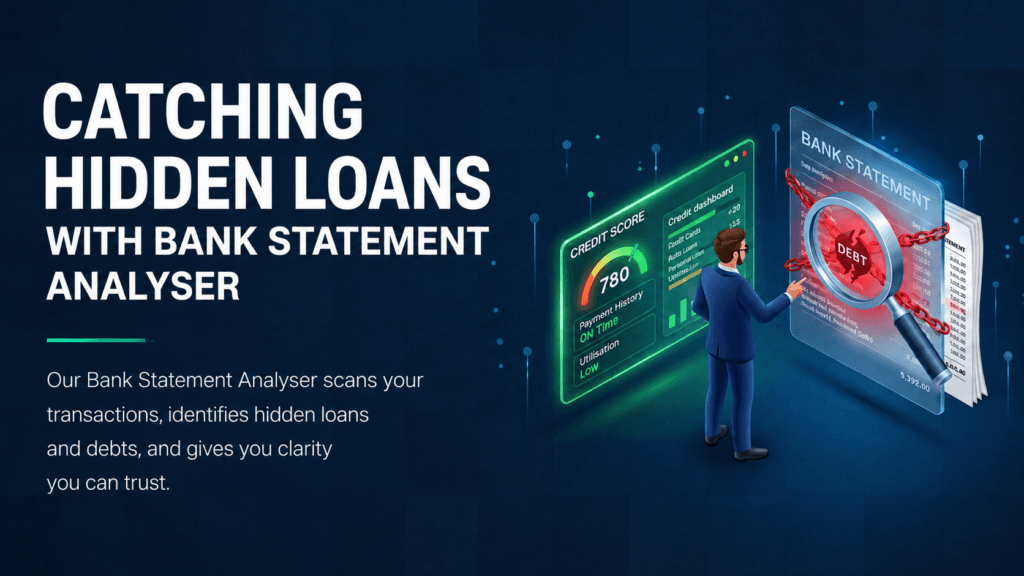
Here is where it gets critical for lenders. Bureau reports carry a lag of 30 to 90 days. They may also miss recently opened accounts, informal loans, or buy-now-pay-later commitments. A proper bank statement analyser captures actual cash outflows in near real time — giving underwriters a live debt obligation map that no bureau report can replicate.
Consider this: a borrower with a 780 CIBIL score and ₹80,000 net monthly income carries ₹50,000 in existing EMIs. EMI burden ratio: 62.5%. That is a high-default candidate regardless of what the credit score says.
The score said yes. The ratio said no.
👉 Want to see how a bank statement analyser can help your team surface these hidden risk signals instantly? Explore the tool now.
If you want to understand how credit scores and bank statement data compare as risk signals, check out our blog on Bank Statement Analyser vs Credit Score: Which Tells the Real Borrower Story.
How to extract EMI burden data from bank statements during underwriting
The process does not have to be manual or slow. But it does need to be systematic.
Pull six months of statements — not three. This gives you a reliable baseline across salary cycles and any irregular payment patterns. Then map every recurring fixed debit: same payee, consistent date, consistent amount. Cross-reference these against known loan account formats and NACH mandate descriptions.
Two additional signals deserve attention during this creditworthiness assessment:
Bounce patterns. Even a single EMI bounce in the review window is a stress signal. Multiple bounces suggest the borrower is already at capacity.
Irregular high-value withdrawals. These can indicate undisclosed EMI payments routed through a separate account or informal lending arrangements.
For teams handling volume, API-based Bank statement analysis tools can automate FOIR extraction significantly, reducing manual effort and human error. One important note: the FOIR calculation is only as accurate as the income figure used. Always average net salary credits across the full six-month window — not just the most recent month.
For a broader look at how financial professionals read borrower behaviour from statements, explore our blog on How Financial Professionals Use Bank Statements to Predict Borrower Behavior.
Setting EMI burden thresholds: what lenders actually use
There is no single universal number. But there are well-established benchmarks that most lending institutions have converged on — and for good reason. Investopedia’s framework on debt-to-income ratios similarly recommends that total debt obligations remain below 43% of gross income for a borrower to maintain financial resilience.
Salaried borrowers: the 40–50% FOIR ceiling
Most banks and NBFCs set a soft ceiling of 50% FOIR for salaried profiles. At this level, the borrower retains enough disposable income to absorb an income disruption without immediately defaulting.
Treat the 45–50% range as an amber zone. These cases should not be auto-rejected — but they require compensating factors: a co-applicant with clean income, a stronger LTV cushion, or a long employment tenure.
Self-employed borrowers: tighten to 35–40%
Irregular income amplifies the denominator risk. When net monthly income fluctuates, even a moderate EMI burden ratio can tip into distress during a lean month.
For self-employed profiles, apply a conservative ceiling and average income across 12 months — not six. This removes seasonal spikes that can artificially lower the calculated burden ratio.
| Borrower type | Safe zone (FOIR) | Risk flag threshold |
| Salaried (stable income) | Below 40% | Above 50% |
| Salaried (variable/bonus-heavy) | Below 35% | Above 45% |
| Self-employed (regular revenue) | Below 40% | Above 45% |
| Self-employed (irregular income) | Below 30% | Above 40% |
To understand how modern credit risk frameworks are evolving beyond FOIR, read our blog on Credit Underwriting: Modern Risk Evaluation.
4 ways to operationalize EMI burden ratio checks at scale
Knowing the metric matters. Embedding it into your process is what actually reduces NPA risk.
- Integrate bank statement API pulls into your loan origination system so the EMI burden ratio is auto-calculated at the application stage — before any manual review begins.
- Flag applications above 45% for senior credit review, not automatic rejection. A 48% ratio for a borrower with 12 years at the same employer carries a very different risk profile than the same number for a first-year self-employed applicant.
- Build EMI burden ratio into your scorecard model as a weighted variable alongside bureau data, income stability, and vintage. A single ratio in isolation is a signal. Inside a scorecard, it becomes a decision.
- Re-run EMI analysis at disbursement for top-up or revolving credit products. The burden ratio at top-up can be significantly higher than at original onboarding — especially in a rising rate environment where older loans have been repriced.
To see how leading lenders are automating these checks end-to-end, explore our blog on Automating Loan Assessment with Bank Statement Analysis.
👉 Ready to simplify your underwriting workflow? Get started with our bank statement analyzer and auto-calculate FOIR, debt obligation maps, and bounce flags — all from a single upload.
The metric that protects your portfolio — if you build it in
EMI analysis is not an additional compliance step. It is a risk gap closer.
Bureau data tells you the past. Income documents tell you what a borrower earns. The EMI burden ratio tells you what is actually left — and whether your loan fits inside that margin safely.
Lenders who embed this ratio into their underwriting workflow catch over-leveraged profiles before they become NPAs. Those who rely on credit scores alone keep discovering defaults that, in hindsight, were never invisible.
The data was always there in the bank statement. EMI analysis is simply the process of knowing how to read it.
👉 Don’t let hidden EMI obligations slip through your underwriting process. Try our bank statement analyser today and build a more default-resistant portfolio — starting with your next application.