In the quest for sharper, faster, and more reliable credit underwriting, forward-thinking lenders have moved beyond traditional financial statements. The most powerful tool for de-risking your portfolio is a detailed GSTR 9 table wise analysis. This government-verified document provides a consolidated, transaction-level view of a business’s entire financial year. For lenders, it’s a treasure trove of data to assess Capacity, Character, and Collateral with unprecedented clarity.
Let’s break down the GSTR-9, table by table, from a credit underwriter’s perspective.
The Executive Summary: Why a GSTR 9 Table Wise Analysis is a Game-Changer
- Verification of Top-Line Revenue: Cross-check declared turnover against loan application figures instantly.
- Working Capital Health Check: Analyze Input Tax Credit (ITC) patterns to gauge cash flow management.
- Compliance & Behavioral DNA: Identify red flags indicating financial stress or poor discipline.
- Data-Driven Consistency: Uncover discrepancies that point to unreliable reporting.
Simplify your borrower vetting process. Explore how our GST Return Analysis Tool automates this GSTR 9 table wise analysis. Get Started Today!
The GSTR-9 Credit Assessment Framework: A Table-Wise Guide
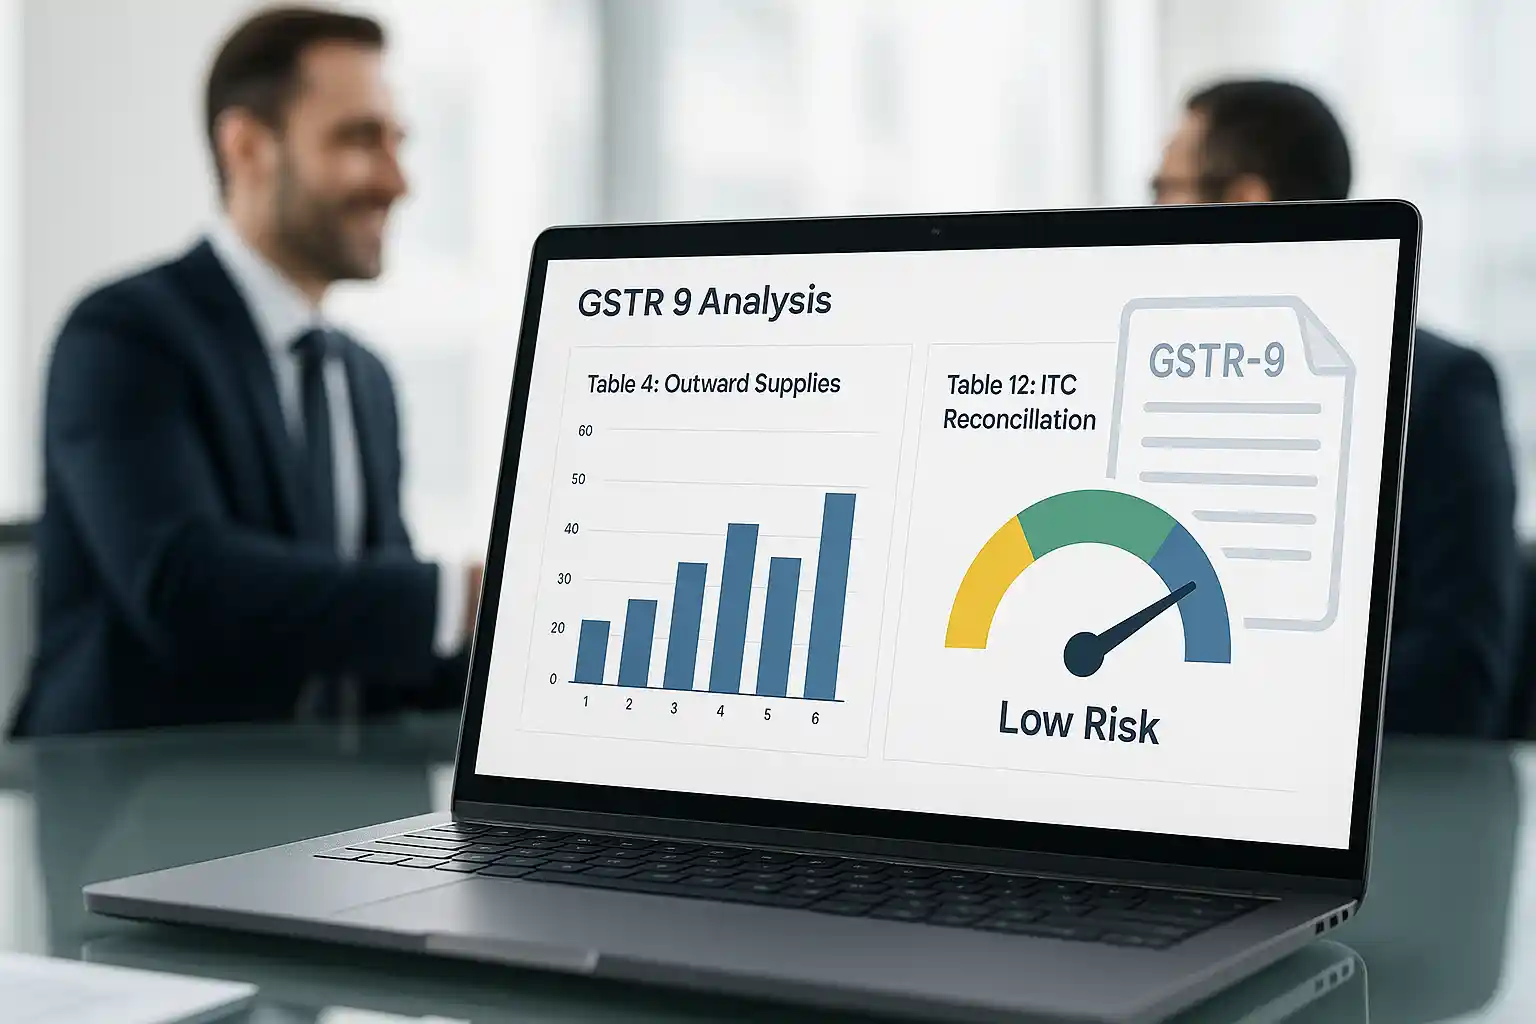
Part II: Validating Business Scale & Activity (Tables 4 & 5)
A thorough GSTR 9 table wise analysis begins with the top-line figures.
- Table 4A (Taxable Supplies): The Primary Revenue Check
- Your Action: Directly compare this figure with the turnover declared in the loan application.
- Key Insight: A discrepancy >5-10% is a major red flag for integrity.
- Tables 4 & 5 (Outward vs. Inward Supplies): The Gross Margin Proxy
- Your Action: Calculate the rough ratio: (Table 4 – Table 5) / Table 4.
- Key Insight: A low ratio suggests a high-cost, low-margin operation, increasing credit risk.
To better understand the foundation of these returns, check out our comprehensive guide on GST Return Types Simplified: From GSTR-1 to GSTR-9.
Part III: The Core Creditworthiness Diagnostic (Tables 6-12)
This section is the heart of your GSTR 9 table wise analysis, focusing on ITC. As noted by the Reserve Bank of India (RBI), the strength of a corporate borrower’s cash flow is a primary determinant of default risk.
- Tables 6 & 8 (ITC Availed): The Working Capital Efficiency Gauge
- Your Action: Note the total ITC availed. Efficient ITC management directly supports debt servicing capability.
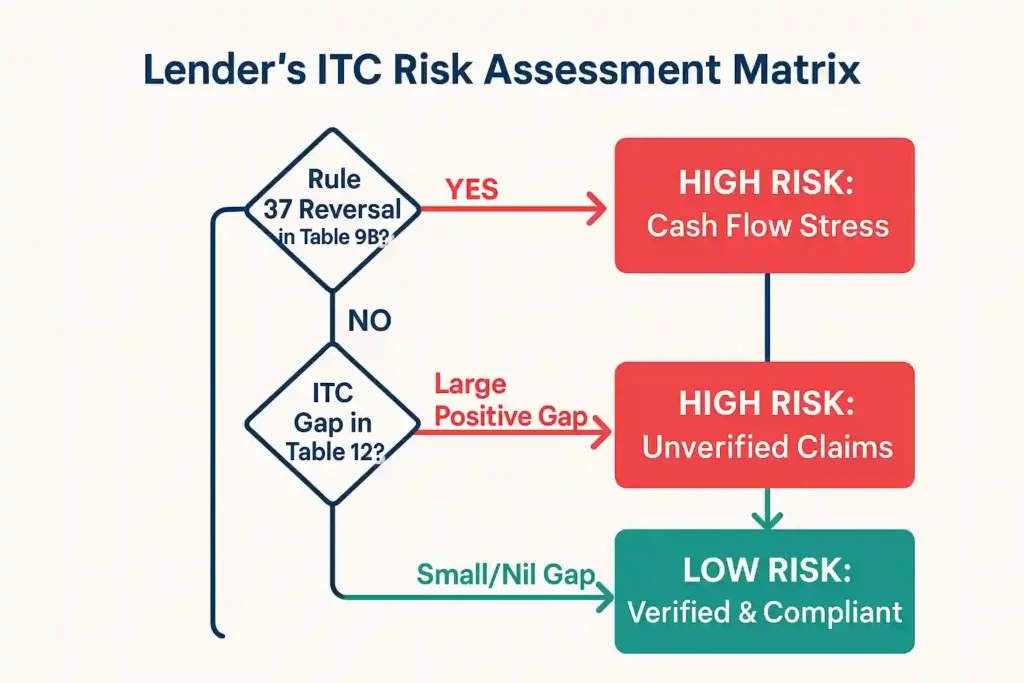
- Table 9B (ITC Reversed under Rule 37): The Cash Flow Stress Test
- Your Action: Scrutinize any value in this row.
- Key Insight: This is a direct signal of severe cash flow distress. If they can’t pay their vendors, their ability to pay your EMIs is highly questionable.
- Tables 10A & 12 (The Reconciliation): The Ultimate Trust Score
- Your Action: Perform this critical calculation: Table 6 (ITC Availed) vs. Table 10A (ITC as per GSTR-2B).
- Key Insight: A large positive gap in Table 12 means the borrower has claimed unverified credit, exposing them to future tax demands and litigation. This should trigger enhanced due diligence.
Dive deeper into the implications of these mismatches in our blog on Analysis of GST Mismatches: A Guide for Lenders.
Don’t manually cross-check tables. Try our GST data analysis platform to automatically flag high-risk ITC gaps and Rule 37 reversals. Explore the Tool!
Part V: Assessing Reporting Quality & Stability (Tables 14 & 15)
- Tables 14 & 15 (Amendments): The Reliability Indicator
- Your Action: Note the volume and value of amendments made after the financial year closed.
- Key Insight: Significant amendments suggest disorganized bookkeeping and question the reliability of all the borrower’s financial data.
Frequent amendments can be a sign of deeper issues. Learn to spot the warning signs in our article on Tax Evasion Signs and GST Checks.
Conclusion: Elevate Your Credit Model with a GSTR 9 Table Wise Analysis
For the modern lender, a systematic GSTR 9 table wise analysis is no longer optional. It is a critical due diligence step that provides validation of stated financials, early warning of cash flow problems, and deep insight into a borrower’s compliance character. According to global data from Investopedia, trend analysis of verified transactional data is a cornerstone of robust financial modeling and risk assessment.
By incorporating this structured approach into your underwriting framework, you can make more informed decisions, reduce NPAs, and build a healthier, more profitable loan book.
Ready to operationalize this GSTR 9 table wise analysis and make data-driven lending decisions?
Get actionable, automated insights with our GSTR Analysis platform. Try Now and transform how you assess borrower risk.